
You will have a far better life if you have a financial plan, stick to it and revisit that plan every couple of years. You will feel more in control and you’ll achieve your goals far easier and much sooner. I have no doubt about that. And based on the last 30 years of my professional experience, I can guarantee that this is true.
But that doesn’t mean you have to pay anyone to run this for you. You can create the most important elements of your financial projections yourself. While this is not a comprehensive approach, it gives you the basics of where you stand now and what you need to do now to improve your situation immediately and in the future.
I’m going to show you how to do this right now. Also, I’m going to provide a few spreadsheets that you can download and use yourself. It’s not complicated and it doesn’t even take that long.
Before you get started you need some data:
1. Spending/Earnings/Savings. What does it cost you to live, on average, every month? How much do you earn? How much do you save? How will that change over time? You don’t have to be 100% certain of these numbers but you do need a reasonable approximation.
2. Inflation. Over the last several years, inflation has been tame. But over the last 20 years, prices have risen, on average, a little over 3% each year. What inflation figure do you want to use?
3. Assets and Liabilities. Before running a financial plan, you must have a balance sheet that lists all your assets and all your liabilities.
4. Estimated Rate of Return. Depending on how you invest your money, you need to make some assumptions about the returns you’re going to enjoy. The only way to estimate returns is to do so over a long period of time.
Nobody knows what the stock market is going to do this year or next. But you can make some assumptions about the returns over the next 20 years. (Of course, even that is tricky. While the long-term average returns of the market are about 9% per year, there can be long stretches of over or under performance.)
5. Tax bracket. What bracket are you in now? What tax rate will you be paying in the future?
Do you have questions about putting your plan together? connect with me.. Maybe I can answer you directly or write a post to answer you in detail.
As you can see, creating a financial plan requires lots of assumptions. Make the most reasonable assumptions possible, of course. But even then they can turn out to be wildly off-base. That is the reason I like to run plans that are easy to update as your situation changes. It’s also the reason I like to update plans every year.
Let’s take a very simple example. Assume:
- You spend $4,000 a month (before taxes). That’s $48,000 a year. We will have to adjust that up for inflation.
- You save $500 a month ($6,000 a year), which goes into your 401k.
- You are in the 35% marginal tax bracket.
- 3% inflation rate
- You want to retire in 20 years.
- You estimate that your return on investment is going to be 6% on average.
- You have $100,000 saved up in your retirement accounts presently.
The first step is to estimate how much money you are going to accumulate.
Consider your $100,000 retirement account. You assume that it will grow at 6% for 20 years and you will add $6000 a year to the account. Here’s what it will be worth at that time:

Now, let’s consider how much income that $551,427 will generate 20 years from now. Assume that you withdraw 4% of the account value per year once you retire.

That’s how much money your investments will generate in 20 years if all our assumptions are true. Now let’s consider what you’ll need after inflation.
You spend $48,000 now. If we assume you will spend that same amount but adjust for 3% inflation, what will you be spending 20 years from now?

Tying it all together.
For this example, you’ll spend close to $87,000 but only have about $22,500 a year coming in. Before you hit the panic button, let’s consider other sources of income like Social Security, rent and pension income.
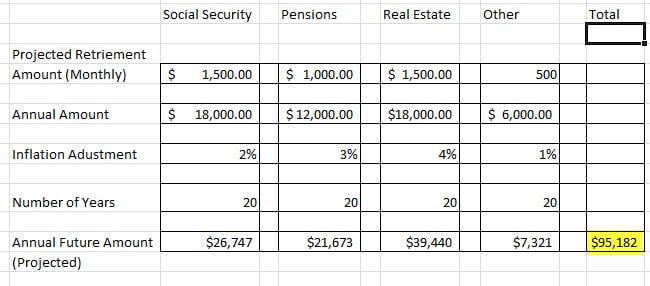
In this case, you have Social Security, pension, real estate and other income which will probably be over $95,000 by the time you retire. That plus the $22,500 provides more than enough income to pay your projected retirement expenses 20 years from now. Now you have a plan you can work with! And it wasn’t all that tough to do. Right?
Now, all you have to do is:
- Make sure you save the $500 a month no matter what.
- Keep that real estate working for you.
- Avoid doing something dumb.
- Make sure your expenses don’t climb about your projections (plus inflation).
This is the entire purpose of the exercise – to determine exactly what you need to do or change right now and to be laser clear on what is most important.
If your plan doesn’t work, you still have a few choices:
a. Save more and spend less.
b. Work longer.
c. Get a part-time job once you retire.
d. Invest more aggressively (Although I don’t like the idea of getting over aggressive. I suggest you work towards a combination of a, b and c instead assuming you already do have growth in your portoflio).
From this example you can see that creating your own financial plan isn’t all that difficult. Once you have a clear picture of what questions to ask yourself, the rest is straightforward. Go through the exercise and download this retirement calculator spreadsheet. Make your own rough projections and update them yearly.
Have you created your own financial plan? What changes did you make as a result?
Jimmy says
I like the details plan you have given on how to make a financial plan. I think most important thing when making a financial plan is to consider inflation.
Neal Frankle, CFP ® says
Jimmy. Thank you . Inflation is critical I agree. I appreciate it sir.
Wayne Fogel says
Great reading thank you.
I’m age 65 and the wonderful woman I was married to for 41 years until called to heaven was smart! We had a young business she owned, I worked for the business. I couldn’t get Social Security from that company so she bought a disability policy and term Insurance. We had whole life insurance so we kept it in force! two years later I was age 37 and became disabled and my policy paid monthly benefits for 28 years that and Social Security allowed me to live with dignity!
All my insurance had waiver of premium riders. She became ill 10 years later and her insurance also went on wavier! As it turns out my term insurance converted to whole life backdating to the day it was written! I knew way before these events she was one in a billion! but now! Surely one in a trillion!
Certainly our experience thank god! is not the norm.
From your writing I can see how you know your stuff!
I vote for the largest term policy you can reasonably afford! And disability income insurance. If there is an even worse event then death!
It’s living disabled and being a burden to those you love. Plan for worst and pray for the best!
Neal Frankle, CFP ® says
Wayne, first I am sorry for your loss. Your wife sounds like she was a wonderful person indeed. And I agree 100% – disability is a far greater risk than premature death. I am so glad that the insurance you had worked out for you and that you have a solid life plan and have executed it well. Thanks so much for sharing your story sir. Wishing you all the best!
Neal
Ana says
This is great info Neal. I’m going to start creating my families’ financial plan using this information. Thank you!
Neal Frankle says
Great! Please keep me in the loop. Let me know how it goes!
Tony Pagnotto says
I am 62 and will be 63 in April 2013. I have very little saved sue to a late divorce. Maybe 25K. I have a windfall of 210K that I will receive in January 2013.
1. How do I invest that 200K
2.I live in PA and I can receive unemployment.
Where do I einvest that 210K so I can retire now? I don not need a lot. The medical insurance will be my biggest espense other than Rent.
Neal Frankle says
Tony,
In terms of how to invest, I would have to speak with you to get more information to really understand your situation. There is an expenses associated with that and if you prefer not to incur that cost, read these:
How to invest now
Best investments for income
If you want to connect with me., I would be happy to assist further.
Neal@Wealth Pilgrim says
Tasha, Sounds like you are a focused hardworking young woman. I am very excited to hear about your continued success.
krantcents says
The hard part of the equation is figuring out what may happen over thirty years of retirement. The unknown expenses that can catch you off guard. I think I have enough, but I really don’t know.
Ronald Dodge says
Our current monthly spending is about $3,100 (A portion of this does cut down on the principle of the debt, so that part of it does go to countable savings), but then that’s also for a family of 7 and having to service some debt (student loans and a mortgage). As for retirement, we can knock out roughly $1,000 for debt service and another $1,000 attributed to the kids. As such, that leaves $1,100 left initially. However, we would need to add to that $1,100 by so much as well for things like travel. Even with employment expenses not being there, travel will be there. As such, it can be more like about $2,500 just for us 2 per month. That would then mean a minimal of $30,000 per year, which at 2% withdrawal rate, that would mean a net after tax base effect of $1,500,000.00. Of course, I already did our estimates to reach a point of 3,500,000.00 net of taxes come retirement years for total investable assets in today’s money power. We still have a long ways to reach that point, but after our initial 10 years of effort, we can finally say we are starting to see the snowball effect, though still on the weak side.
Ronald Dodge says
I have created my own set of financial stuff within Excel, but then even the other financial software out there all seem to have come short in one area or another for what I cover in my financial files. The one main file though is the one I have various things in it.
Item 1: Spending/Earning/Savings
As for earnings, I put this into 2 basic categories. Gross Earned Income (The income as a result of working for it) and Residual Income (Income created by money put to work for that income). Why do I distinguish between the 2?
Earned Income is money that is mostly used for current expenses, but also have to be used for countable savings which I set 25% of actual gross earned income must go to such countable savings.
Residual Income is either in retirement funds (That is specifically to help with that purpose, but must have contributions to help that residual income so as to be able to retire relatively comfortable) or in the Emergency Fund (Note, the EF is not in just some 0.10% APY savings account. It is actually an overall investment of the money that’s available here and now). Yeah, yeah, I know Dave Ramsey would be saying I’m playing with death with this, but there’s some very important things about this fund that has to take into account of other things such as reparation/replacement of long-term assets over a longer time period when *REAL* inflation and taxation will eat up the power of that money otherwise.
As such, it stands to reason, residual income CAN NOT count as part of “Countable Savings”, but if such money is taken out of such investment, that money taken out is then counted *AGAINST* “Countable Savings”, which is in the opposite direction of the goal.
Item 2: Inflation
When I think of inflation, I not only think about the increased costs on the same goods (many people in society want you to only think about this aspect of inflation, but also the aspect of increased demands placed onto households by both the society itself and the government. Two such areas are safety (How much did people have to pay for various safety stuff say 30 years ago as compared to now day? Very little as far as I’m concerned), and technology gadgets (eventually after a while, how much of the technology gadget does society tend to require us to have available to us such as for communication purposes)?
I also don’t buy into such argument that such things truly save us money over the long run. If we are in the business and we find ways to save time, which then ultimately saves the business money (Even if it ends up costing the business more money up front), that’s one thing, but to require households to pay for those same items for the same costs, even though it doesn’t do much for households in regards to saving money, no good argument. The only item I have found to where this argument may actually apply, but even then, only from an indirect stand point of view, not directly, the computer with a spreadsheet program. Why do I say that? True, it’s not those 2 items themselves that have saved us money as those 2 items cost us money. On the other hand, with the help of the spreadsheet, I created my own financial files with the various things in it. By having the system do the work much more accurately and much more faster than what I could humanly do while also tracking our stuff, it has more or less served as my financial adviser. Not only has it served as my financial adviser, it has saved me in so many cases of not using the money else where. The worksheet that saved me of this very thing is the “Cash Flow Management” worksheet. That worksheet is by far the worksheet I use the most and it has had the greatest benefit.
As for any other added expense on the home front is concerned, there is no such argument for a such expense. That’s why I not only add in the inflation of goods/services, but also add to it the increased costs to the increased standards of living put onto households by it’s society and government.
Item 3: Assets and Liabilities
This was one of the very first things I did within the spreadsheet program after me putting together the cash flow management worksheet (The cash flow management worksheet was the very first worksheet I did). As for me, this is what’s known as the balance sheet, which I would not only say Assets and Liabilities, but also Owner’s Equity. Even when I had first put it in, my OE was very much so in the negative territory. Now it’s 5 digits in the positive side after taking taxes into account.
Item 4: With the help of tracking within my own spreadsheet program, I have determined rate of return can vary greatly depending on what set of assets and with whom you have it if it’s not self done. Example: The retirement account with the employer returns about 2% below benchmarks even though stated expenses are only suppose to be between 0.50% and 0.75% according to prospectus, but the remaining 1.25% to 1.50% is assumed to be taken out via the 12b loophole (so called operational) fees, so that’s why I put employer’s retirement account at 2% below market benchmarks. My other investments outside of account has been trending about 1% above market benchmarks, though 2010 year was way above, but that’s more of an exception than the norm.
Item 5: Tax Brackets, I do highly suspect we will end up in the federal 35% and state 8.1% tax brackets (thus where I get my 43.1% from as this not only take into account of federal, but also of state income tax) come retirement years. However, if I move to some place like TN, I will instantly cut out that 8.1% income tax. The only thing I would end up taking up would be the consumption tax rate but even that would only go up by about 3.5%, which that’s still a net of 4.6% savings.
20 and Engaged says
Creating a financial plan is a really good idea. You can plan years in advance and make adjustments as different things change. I’ll make my 2011 plan based on where I see myself (or want to see myself) in 5 years.